Dispersion maps
The spreading maps show the distribution of tracers released from a given position following the current in the selected deep. A small set of tracers is released every hour and the tracers of the requested age are summed up over the whole archive period. This captures the typical spreading and its variability. The map may be viewed as the likelihood of finding a tracer of the selected age.
After choosing a position, by click or by the longitude/latitude, a customized
spreading map can be requested. Behind the scene an instance of the particle-tracking
model LADiM is run. This takes about half an hour, so the map is generated on
request and the user gets an e-mail with the link to the map when it is finished.
The request form pops up after pushing the “Request Custom Dispersion Map” button. The “Start age” field is used to denote the age (in days) when the tracer becomes visible in the map. The default is zero, the tracers are visible the whole simulation time. Similarly the “End age” shows the maximum age of visibility of the tracer. This field must be provided, there is no default. For tracers like salmon lice, a start value of 3–5 days (depending on temperature) and end value of 14–18 days can be choosen to focus on the infective copepod stage. Or, a narrow range like start=6, end=8, may be used to show the likelihood of finding a contaminant after one week.
When the mail arrives, the link points to a custom dispersion map in main screen of NCIS. The map may be zoomed. Currently there is no export functionality, use a screen dump fot hard copy. The custom map will be available for one month.
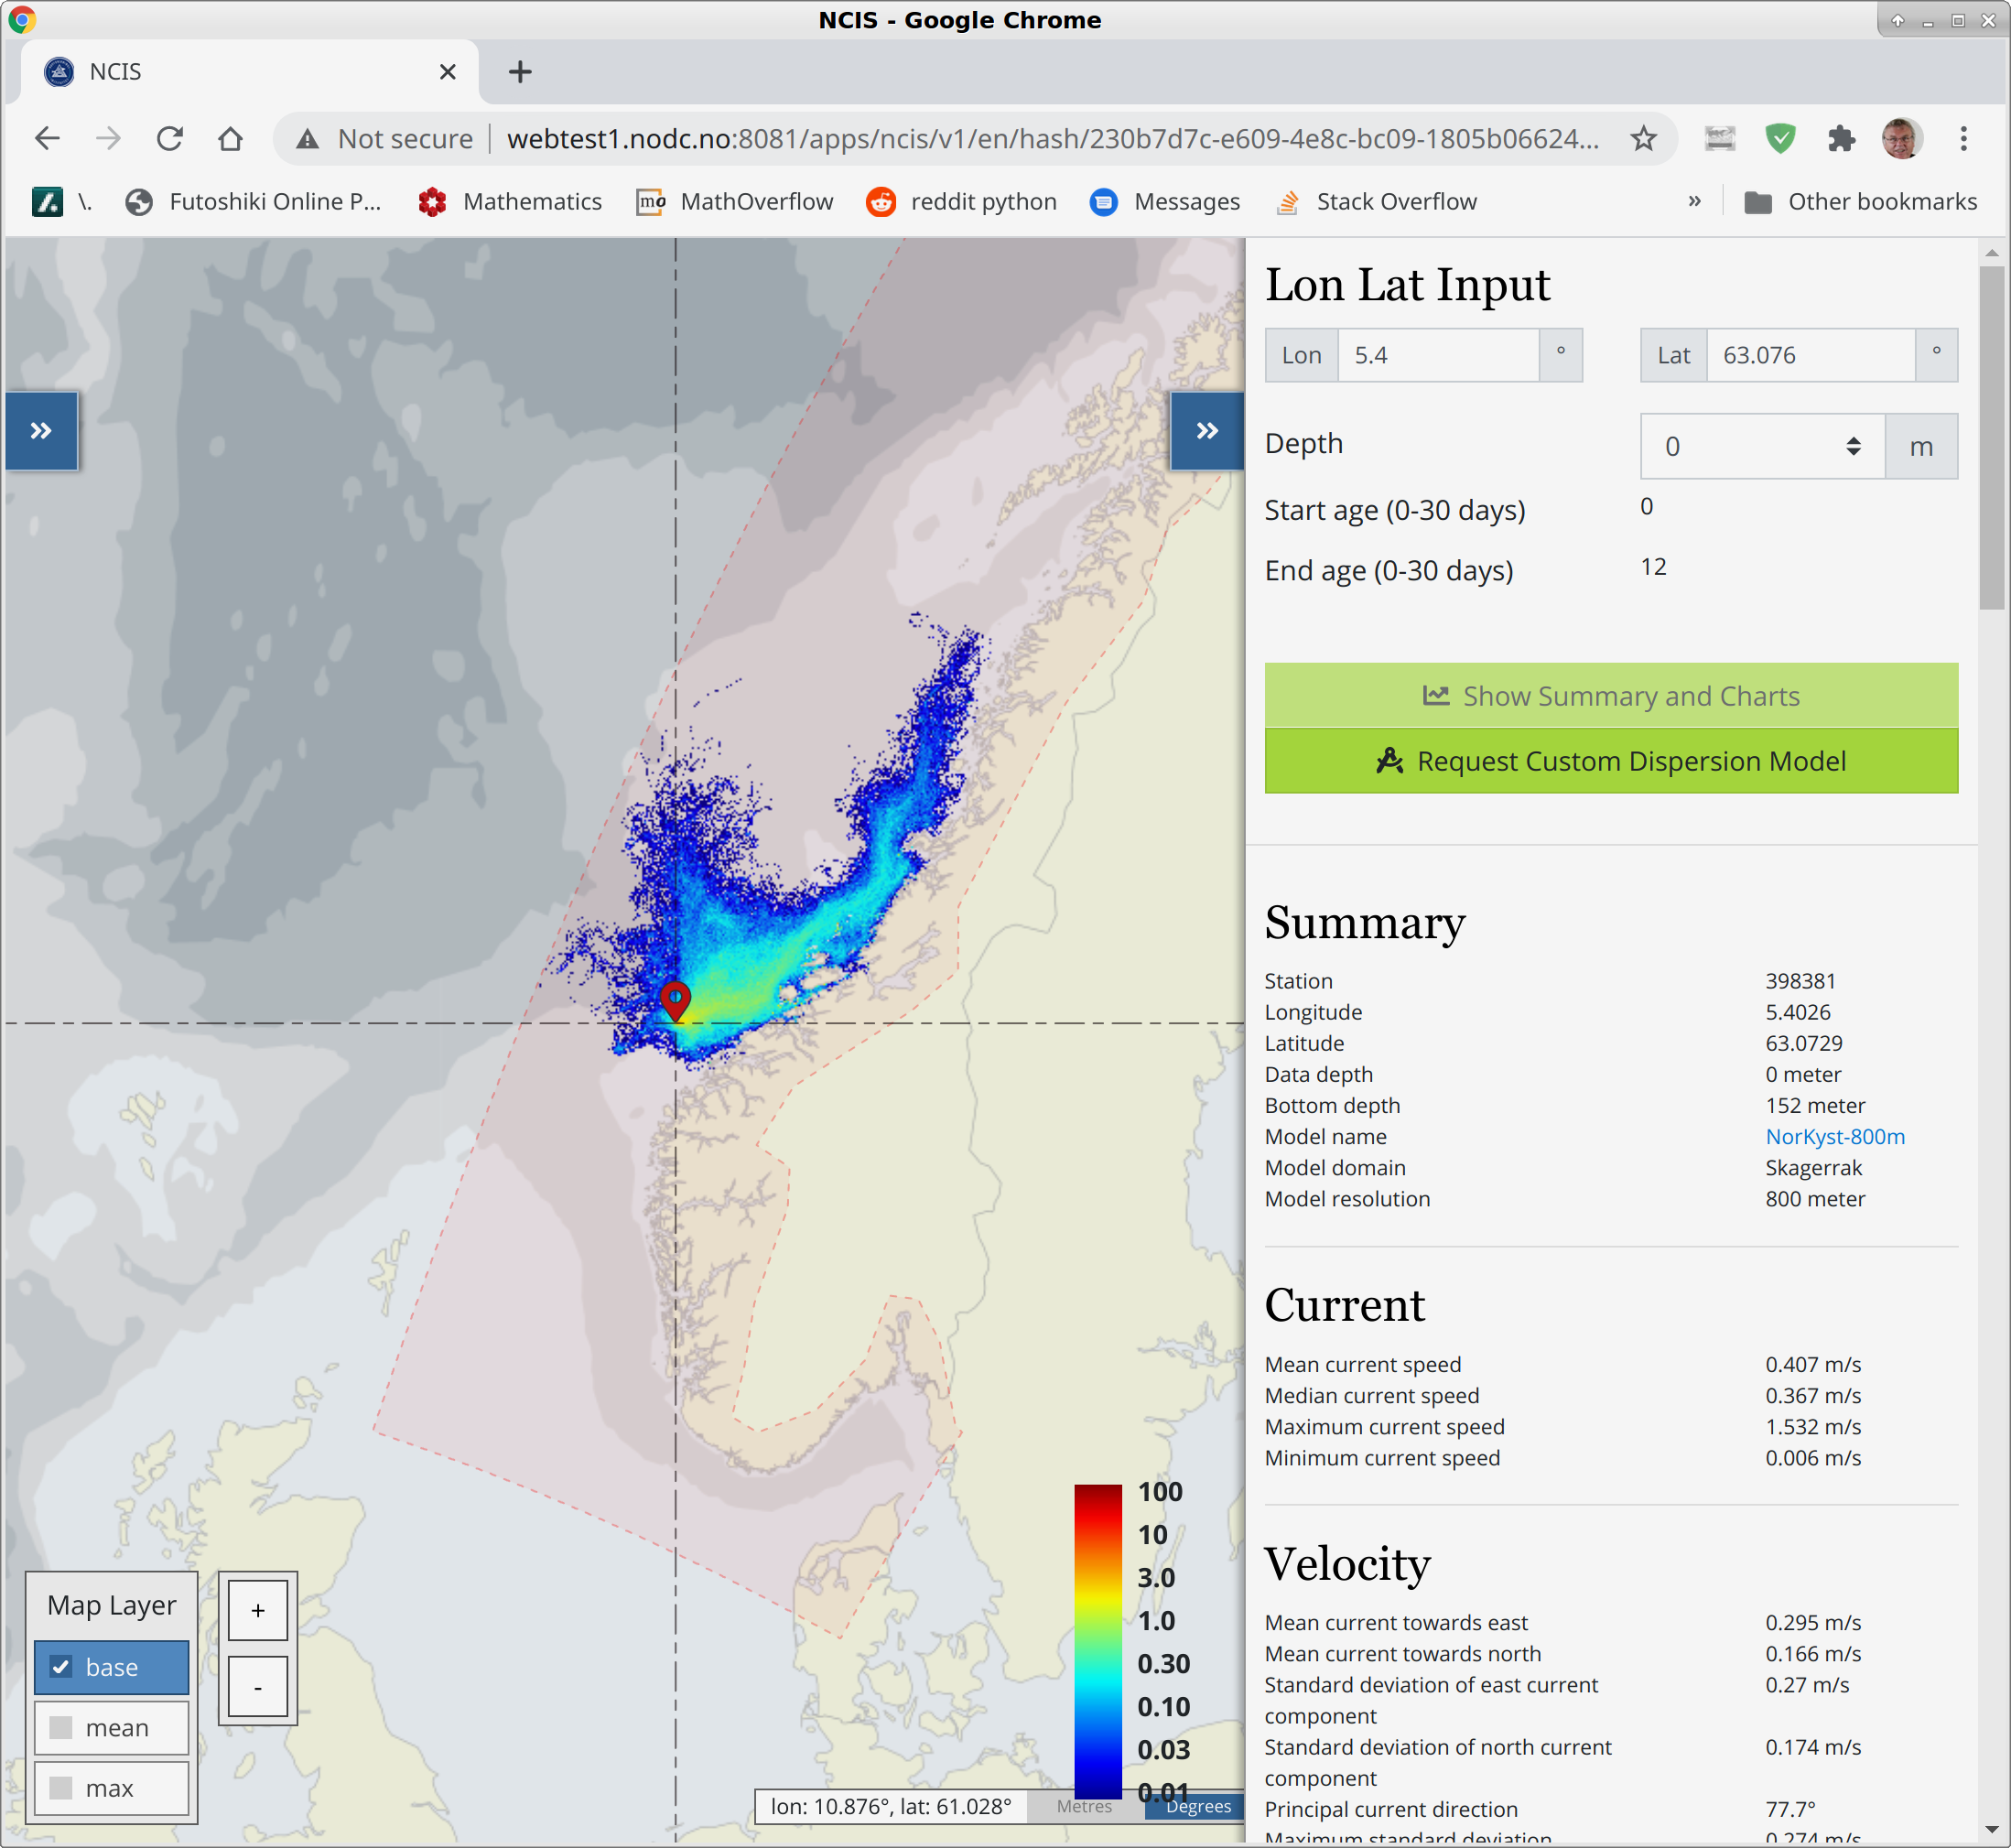
Example dispersion map